
Mitigation Overview
The Mitigation tab of the domain detail view concentrates the automatic and manual IP blocking of the site. From here you configure the rules that block attackers automatically, manage blocked and trusted IPs, and audit everything the mitigation system has done.
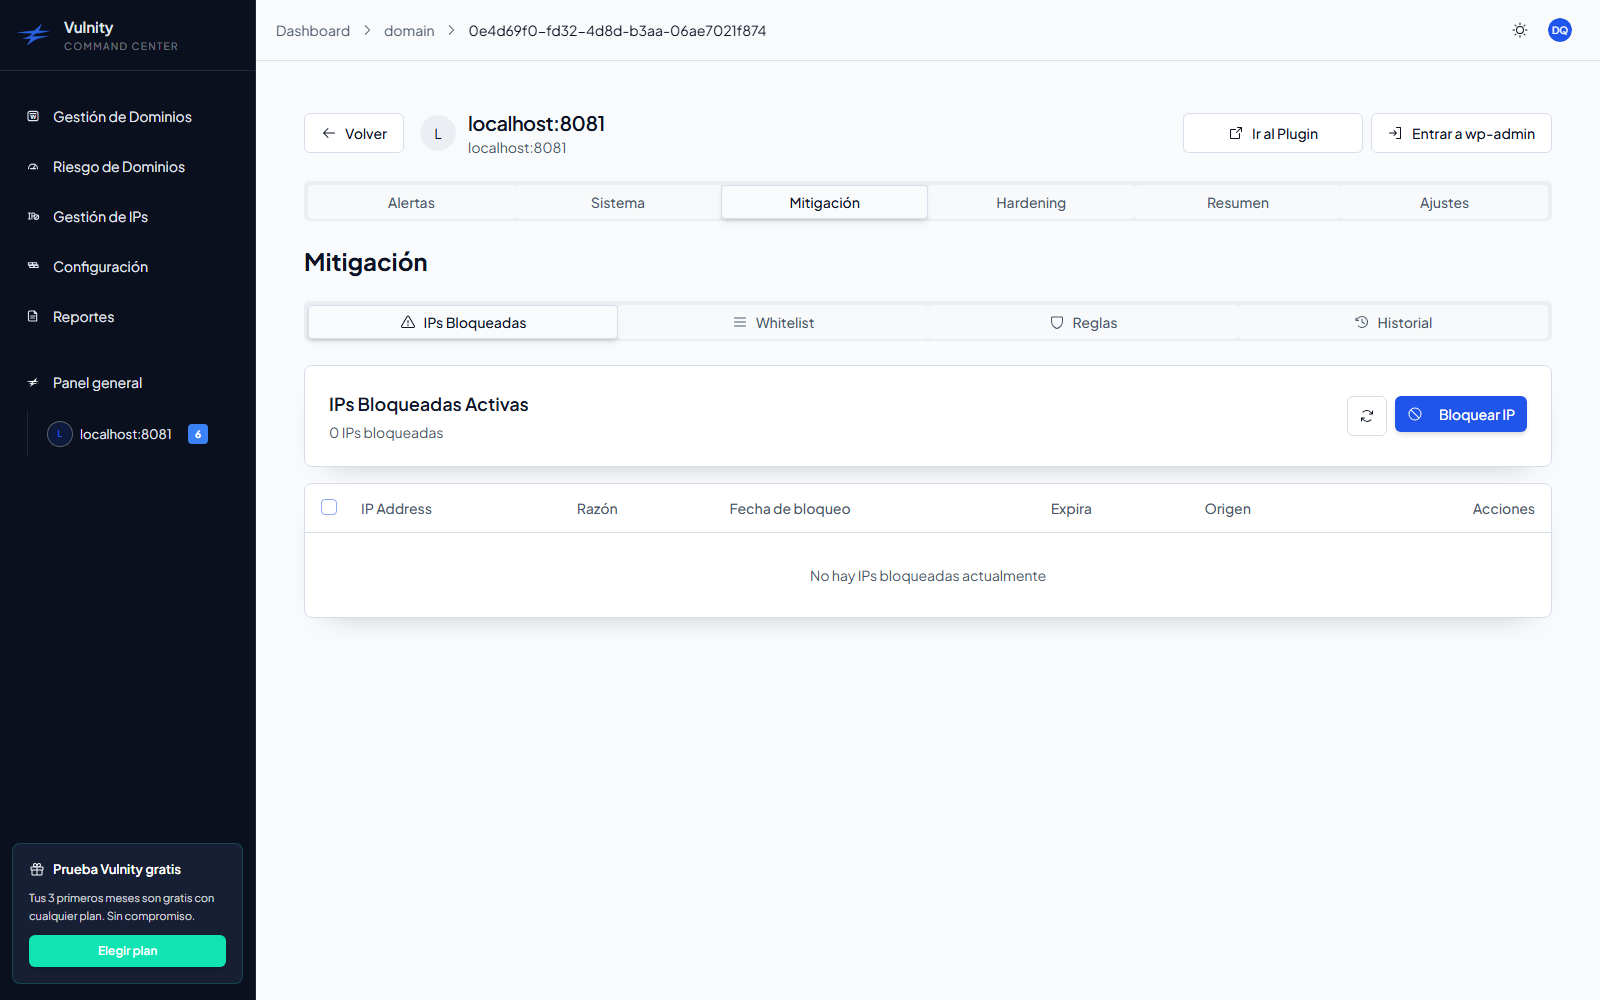
Sections
Section titled “Sections”The Auto-Mitigation Configuration panel is organized in four sub-tabs:
| Sub-tab | Purpose |
|---|---|
| Blocked IPs | View and manage the IPs currently blocked on the site, and block new IPs manually. |
| Whitelist | Trusted IPs that will never be blocked automatically. |
| Rules | Configure the automatic blocking rules per alert type. |
| History | Audit trail of every block and unblock. |
How automatic mitigation works
Section titled “How automatic mitigation works”When an alert arrives from the site, the mitigation system evaluates it against the configured rules:
Alert detected → Rule enabled for this alert type?├─ No → Log only└─ Yes → Severity at or above the rule's minimum? ├─ No → Log only └─ Yes → Event count reached the rule's threshold? ├─ No → Increment counter └─ Yes → Block the IP automatically → Apply the configured duration → Record the block in the historyAll rules ship disabled by default — automatic blocking only starts once you enable rules in the Rules sub-tab.
Mitigation history
Section titled “Mitigation history”The History sub-tab audits every block and unblock on the site, combining actions taken by rules, by administrators from the panel, and by the plugin.
You can narrow the records with the date range (last month by default), an IP search, and an action filter (All / Blocked / Unblocked); counters summarize the total records, blocks, and unblocks found. Each record shows the IP address, the action, who executed it (a user, the automatic system, or the plugin), the affected domain, the block duration and expiration, the related alert when there is one, and the documented reason, with expandable additional details.
Synchronization with the plugin
Section titled “Synchronization with the plugin”The blocks themselves are enforced by Vulnity Security on the WordPress site, so the panel and the plugin stay synchronized:
- Changes made in the panel — rules, manual blocks, whitelist edits — are pushed to the plugin immediately.
- As a fallback, the plugin reconciles its configuration with the panel every 24 hours.
- To force a sync from the site, open the plugin and use Mitigation → Synchronization → Sync Configuration Now.
Next steps
Section titled “Next steps”- Blocked IPs — view, block, and unblock IPs on this domain.
- Rules — configure automatic blocking per alert type.
- Whitelist — protect trusted IPs from automatic blocks.
- Plugin mitigation overview — how the plugin enforces blocks on the site.