
Plugin Dashboard
This is the main screen of the WordPress plugin. It gives you a quick view of your site’s current security status.
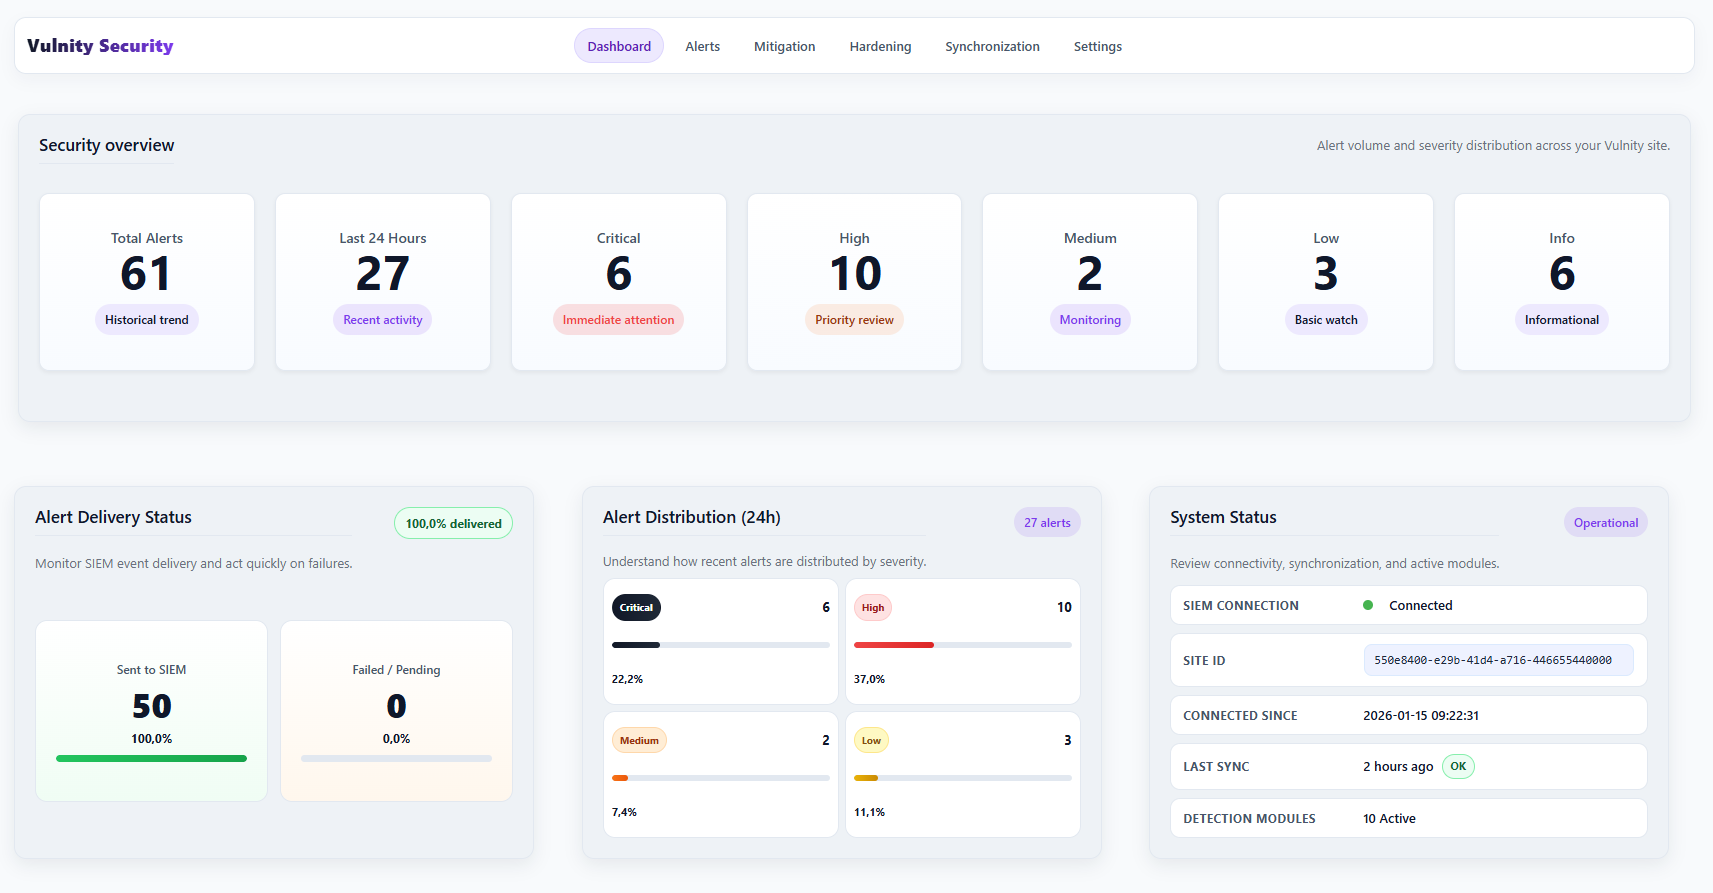
Security overview
Section titled “Security overview”At the top, cards summarize the alert volume:
- Total Alerts — all alerts recorded for the site.
- Last 24 Hours — alerts generated in the last day.
- Critical, High, Medium, Low, and Info — the count for each severity level.
This helps you quickly identify anything that may require urgent attention.
Alert delivery status
Section titled “Alert delivery status”This section shows how many alerts were successfully sent to the SIEM and how many are failed or pending, with their percentages. If deliveries are failing, open the Alerts tab to retry them.
Alert distribution (24h)
Section titled “Alert distribution (24h)”A distribution chart shows how recent alerts are split by severity. It helps you understand whether the site is facing serious attacks or mostly routine activity.
System status
Section titled “System status”Here you can check the health of the integration:
- Whether the SIEM connection is active, with the Site ID and the pairing date.
- When the last synchronization happened.
- The Heartbeat / WP-Cron health. If WP-Cron is not running correctly, a link to the setup guide appears next to the status.
- How many detection modules are active.
Next steps
Section titled “Next steps”- Plugin alerts — review each security event in detail.
- Mitigation overview — see the active blocking protection.
- Hardening — enable additional protections for the site.