
General Overview
The General Overview tab summarizes the security activity of every domain connected to the SIEM. A date selector at the top lets you analyze a specific period, with a one-click reset to the last month.
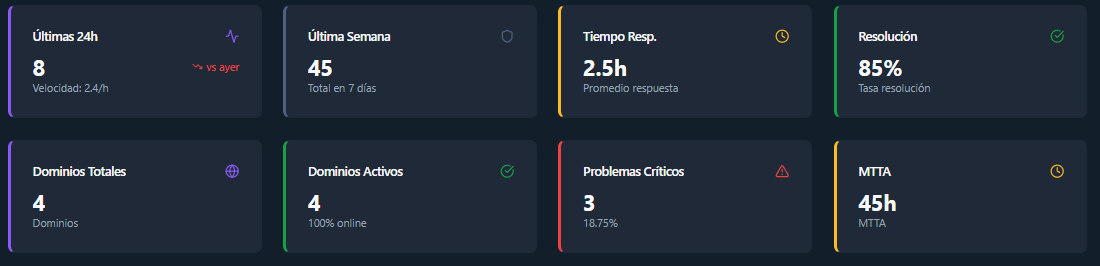
Metric cards
Section titled “Metric cards”| Metric | Meaning |
|---|---|
| Last 24h | Alerts received in the last 24 hours, with a trend indicator versus the previous day |
| Last Week | Total alerts received in the last 7 days |
| Resp. Time | Average alert response time, in hours |
| Resolution | Percentage of alerts that have been resolved |
| Total Domains | Total number of monitored domains |
| Active Domains | Domains currently active, with their online percentage |
| Critical Issues | Number of critical alerts and their percentage over the total |
| MTTA | Mean Time To Acknowledge: average time until an alert is acknowledged |
Charts
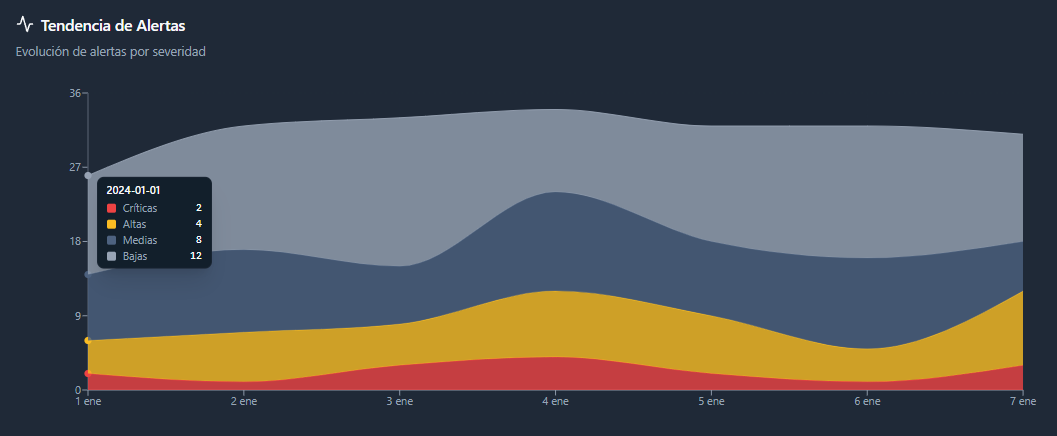
Section titled “Charts”Alerts Over Time shows the evolution of alerts across the selected period, stacked by severity, so you can spot at a glance which severity is firing the most.
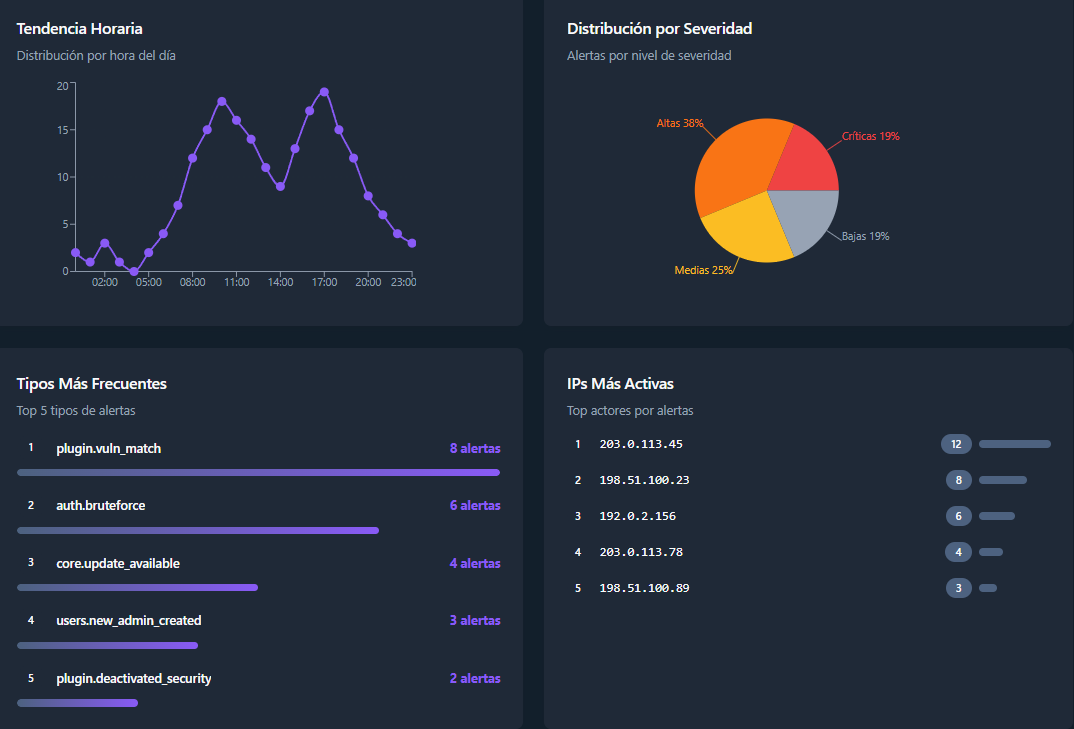
- Hourly Pattern (last 24h): at what times of day alerts are arriving at the SIEM.
- Severity Distribution: the percentage split of alerts by severity.
- Most Frequent Types: a ranking of the alert types that fire most often.
- Most Active IPs: the top attacking IP addresses across your monitored domains.
Next steps
Section titled “Next steps”- Alerts — triage and manage the alerts behind these metrics.
- Reports — turn SIEM activity into white-label reports.
- Automations — schedule recurring reports and notification rules.
- Alert catalog — what each alert type means and how to respond.