
SIEM Alerts
The Alerts tab of the domain detail view manages the alerts of that specific domain. It is the same alert workbench as the general SIEM, filtered to a single site.
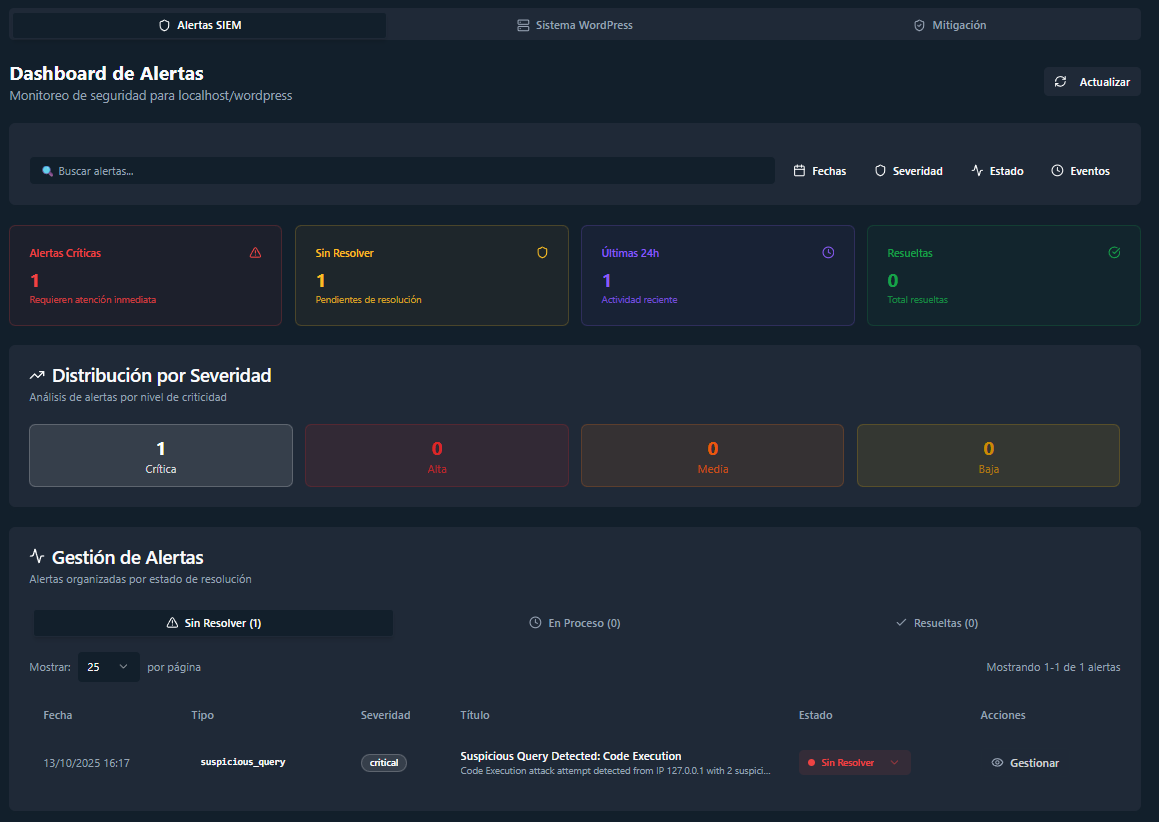
Alerts are organized in three status tabs — Unresolved, In Progress, and Resolved — each showing its total count. New alerts arrive as Unresolved and move through the other states as you work on them.
Alert management panel
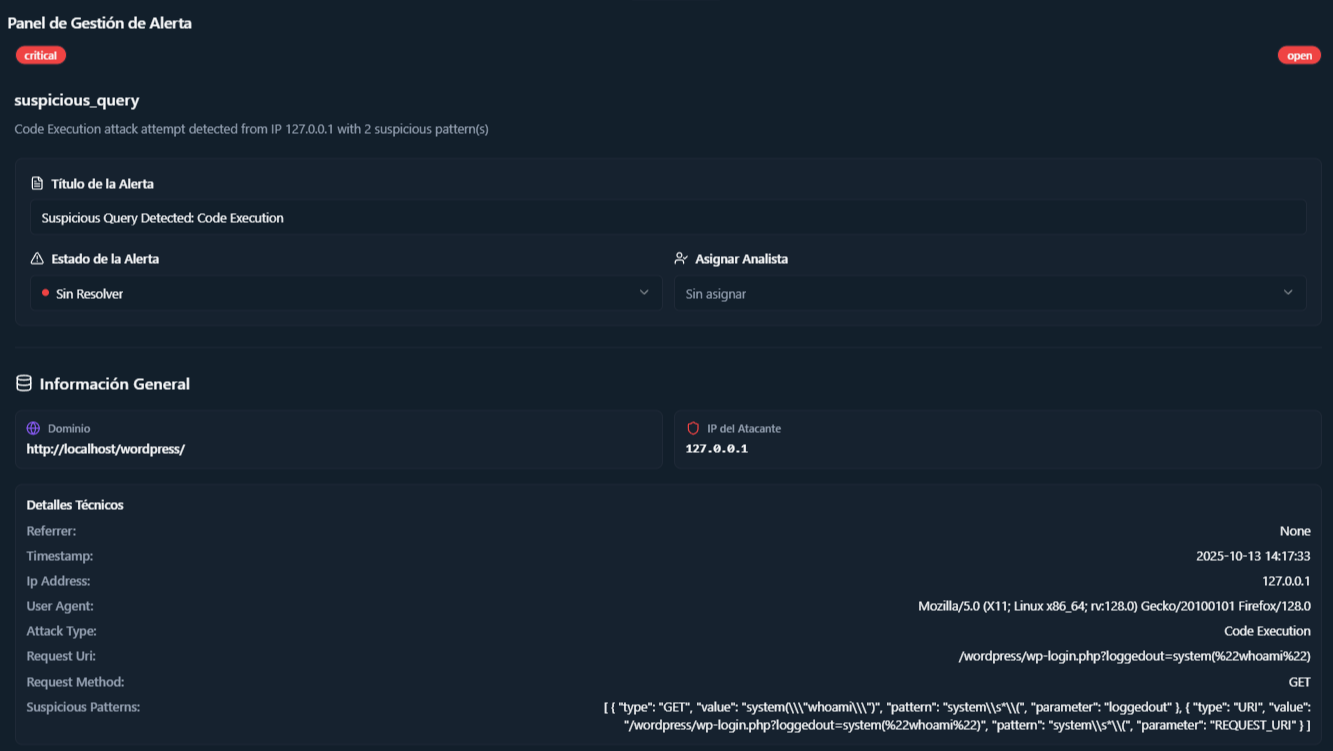
Section titled “Alert management panel”Clicking an alert opens the Alert Management Panel, where each detected alert is analyzed and managed.
-
Review the alert. The header shows severity and current status. General Information shows the affected domain, the attacker IP, and the WordPress user involved when available; Technical Details and View Full Payload (JSON) expose everything the plugin sent, and the Non-Technical Description summarizes the incident in plain language.
-
Adjust the management fields. Change the alert title to identify it more precisely (the default title is kept if you leave it untouched), set the status to Unresolved, In Progress, or Resolved, and assign an analyst from your organization to record who handles the incident.
-
Classify and document the outcome in the Resolution Note section (see below).
-
Click Save Changes. Nothing is persisted until you save — if you try to close the panel with pending changes, it asks whether to save or discard them.
For php_file_uploaded alerts, the panel adds a File evidence section with the file name, original and quarantine paths, size, MIME type, and SHA-256/MD5 hashes, including a direct VirusTotal link to check the file’s reputation.
Example alert payload
Section titled “Example alert payload”{ "schema_version": "1.0", "event_version": "1.0", "event_uuid": "dce1076e-b472-4ce8-b960-6c389169a364", "site_id": "1064b1e1-7916-4d13-9cbd-ab86f6fb55ea", "domain": "http://localhost/wordpress/", "event_type": "suspicious_query", "severity": "critical", "occurred_at": "2025-10-13T14:17:35.009+00:00", "detected_at": "2025-10-13T14:17:35.009+00:00", "summary": "Suspicious Query Detected: Code Execution", "description": "Code Execution attack attempt detected from IP 127.0.0.1 with 2 suspicious pattern(s)", "details": { "ip_address": "72.129.237.221", "user_agent": "Mozilla/5.0 (X11; Linux x86_64; rv:128.0) Gecko/20100101 Firefox/128.0", "attack_type": "Code Execution", "request_uri": "/wordpress/wp-login.php?loggedout=system(%22whoami%22)", "request_method": "GET" }, "status": "open", "count": 1}Mitigation
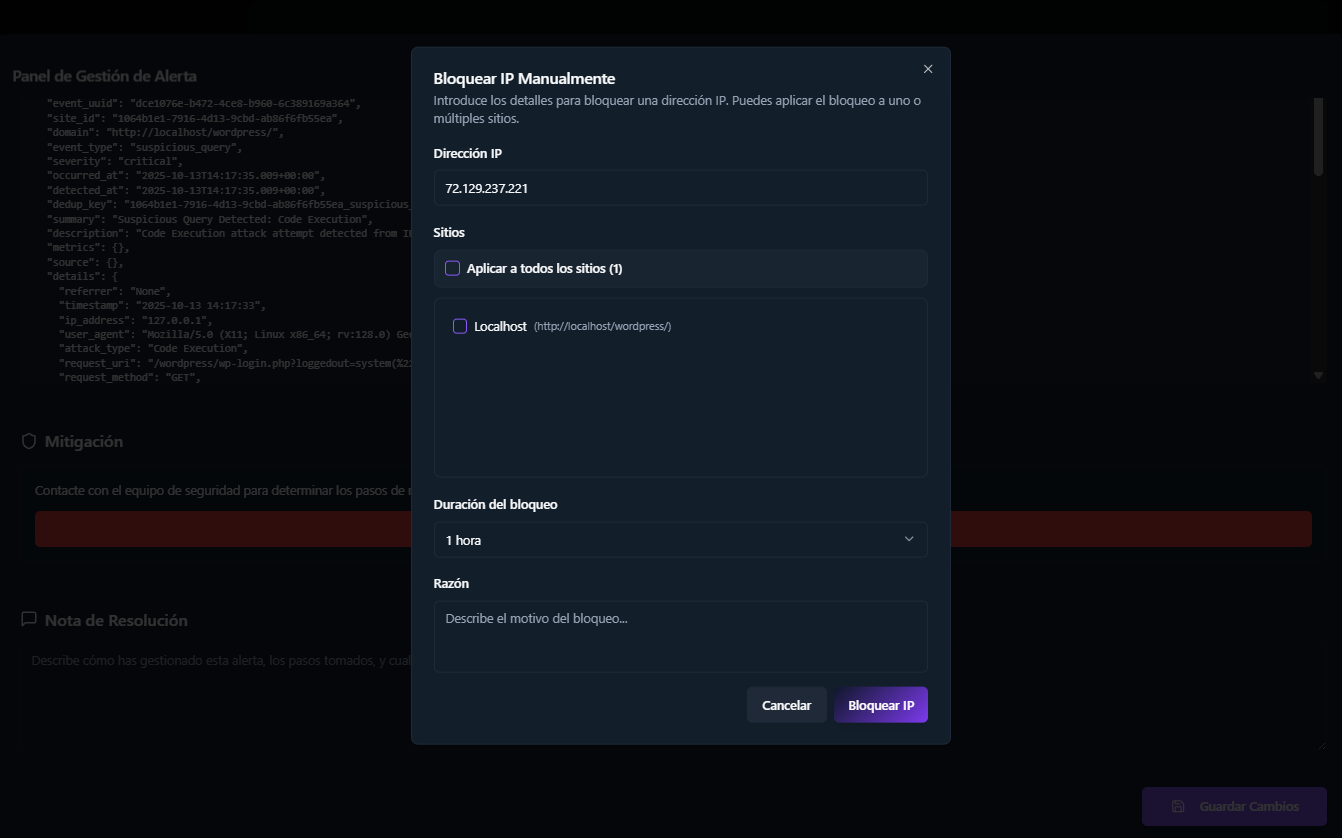
Section titled “Mitigation”The Mitigation section of the panel includes a quick-action button to block the IP responsible for the alert directly: it opens the manual block dialog with the attacker IP pre-filled, so you only choose the target sites, the block duration, and the reason. For manual groups with several attacker IPs, the button offers to block all of them at once.
When a php_file_uploaded alert includes a quarantined file, this section also offers Restore file and Delete file actions, executed on the WordPress site through the plugin.
Resolution note
Section titled “Resolution note”The panel also includes the Resolution Note section, where the person managing the alert classifies the outcome — malicious, false positive, duplicate, benign/expected, or needs monitoring — and documents the resolution process.
This field records actions taken, technical observations, and decisions, keeping a clear and traceable history of how the incident was resolved. Like the rest of the panel fields, it is stored when you click Save Changes.

Next steps
Section titled “Next steps”- Alert catalog — severity criteria, IOCs, and mitigations for each alert type.
- Mitigation → Blocked IPs — review and manage the IPs blocked on this domain.
- Mitigation → Rules — block attacker IPs automatically based on alerts.
- Alerts (general SIEM) — filters, bulk actions, and manual groups across all domains.