
Alerts
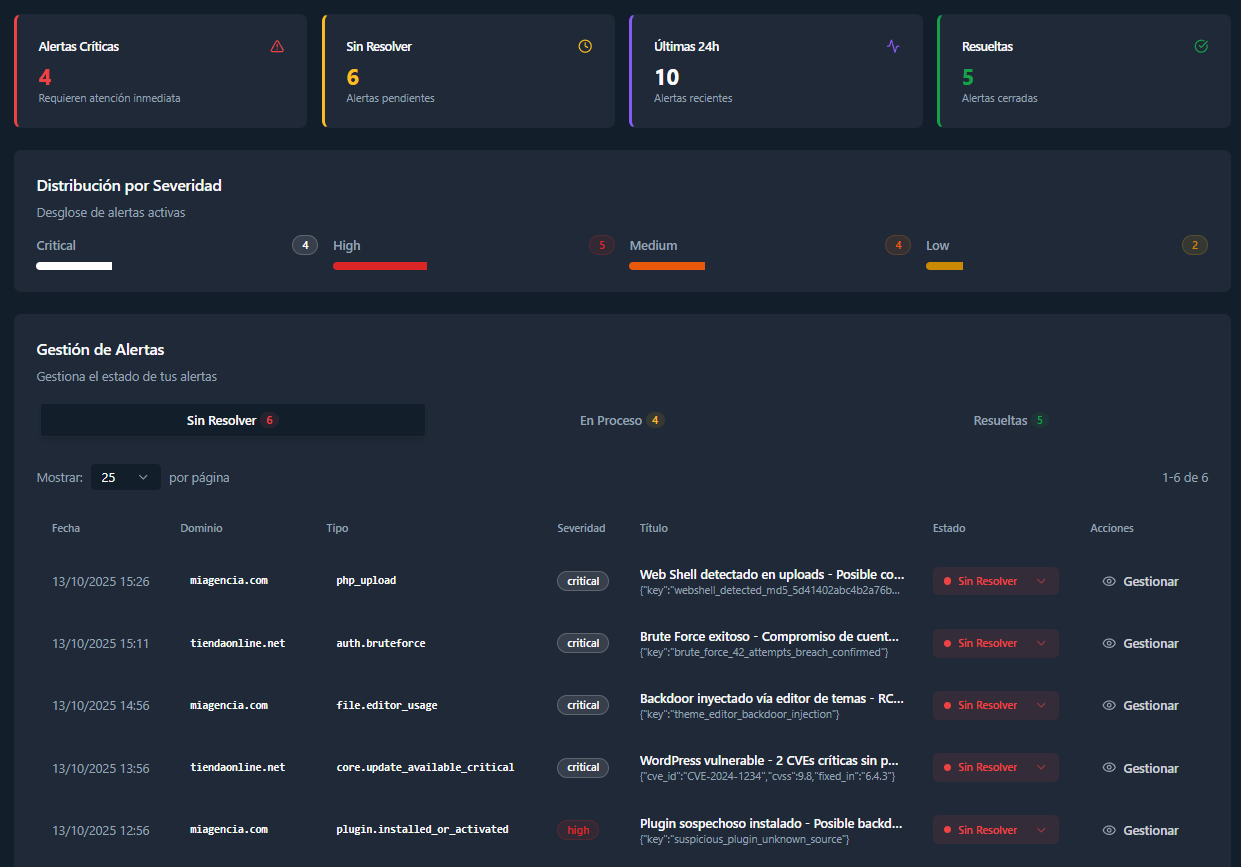
The Alerts tab lists every alert generated by the domains connected to the SIEM, and is where each incident is triaged, managed, and resolved.
Status workflow
Section titled “Status workflow”New alerts arrive in the Unresolved tab. As you work on them they move to In Progress and finally to Resolved, keeping the state and evolution of every incident clear. Each tab shows its total count.
Filters
Section titled “Filters”The filter bar above the list lets you narrow down alerts by:
- Search: free-text search, applied automatically as you type.
- Dates: from/to range, with quick presets (today, yesterday, last week, last month).
- Severity: Critical, High, Medium, Low, Info.
- Domains: limit the list to specific monitored domains.
- Alerts: filter by alert type (
brute_force,suspicious_query, etc.), with a search box.
Active filters appear as removable chips; use Apply filters to run pending changes and Clear filters to reset everything.
Bulk actions and groups
Section titled “Bulk actions and groups”The Select button enables selection mode, with a checkbox per alert to:
- Change status in bulk: acknowledge, resolve, or reopen all selected alerts at once.
- Delete the selected alerts.
- Group the selected alerts into a manual group with a name, description, and color. Groups are pinned at the top of their tab and can be acknowledged, resolved, reopened, deleted, or ungrouped as a unit.
The Mark all as read button marks every alert matching the current filters as read.
Alert management panel
Section titled “Alert management panel”Clicking an alert opens the Alert Management panel, where each detected alert is analyzed and managed.
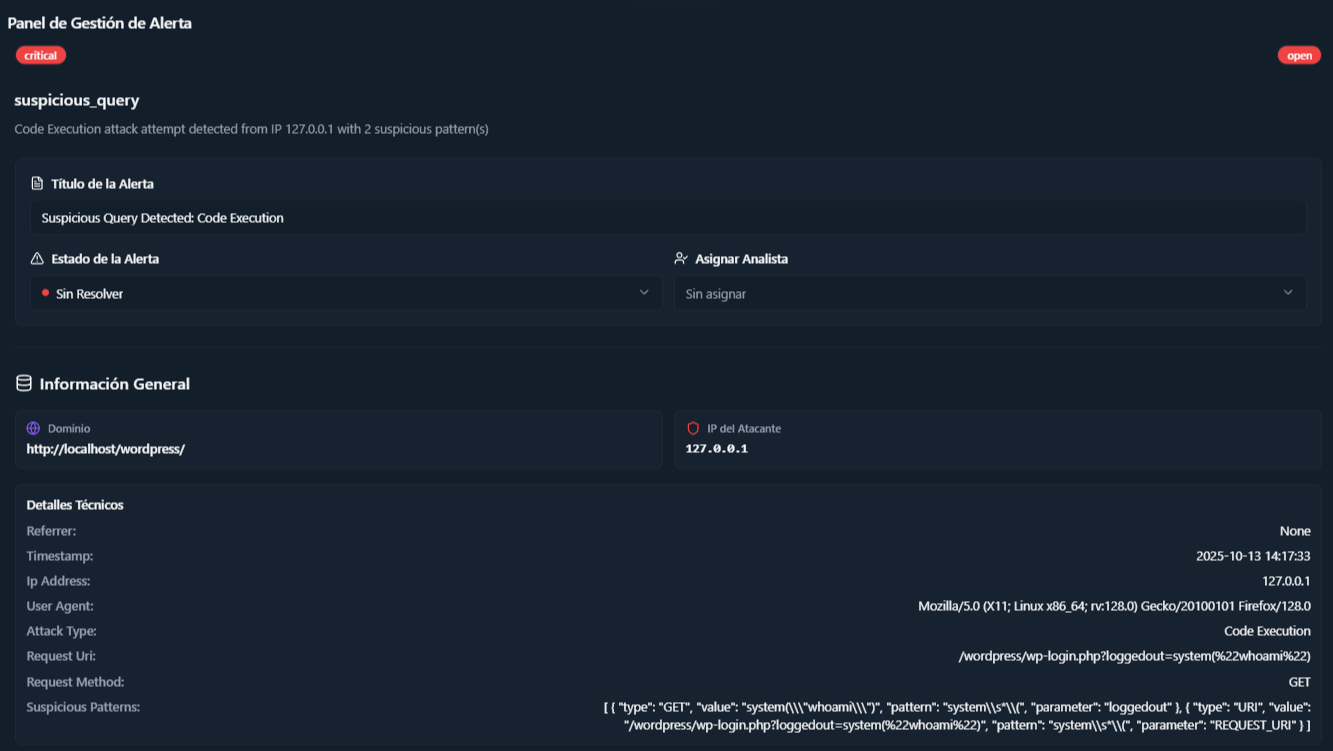
- Change the alert title: rename it for more precise identification. If unchanged, the default title is kept.
- Change alert status: select Unresolved, In Progress, or Resolved according to incident-handling progress.
- Assign owner: change the assigned person and keep a record of who handled or resolved the alert.
- General information: view technical details such as the affected domain, attacker IP, and full payload, where all event data can be inspected.
Example alert payload
Section titled “Example alert payload”{ "schema_version": "1.0", "event_version": "1.0", "event_uuid": "dce1076e-b472-4ce8-b960-6c389169a364", "site_id": "1064b1e1-7916-4d13-9cbd-ab86f6fb55ea", "domain": "http://localhost/wordpress/", "event_type": "suspicious_query", "severity": "critical", "occurred_at": "2025-10-13T14:17:35.009+00:00", "detected_at": "2025-10-13T14:17:35.009+00:00", "dedup_key": "1064b1e1-7916-4d13-9cbd-ab86f6fb55ea_suspicious_query_1760365055060", "summary": "Suspicious Query Detected: Code Execution", "description": "Code Execution attack attempt detected from IP 127.0.0.1 with 2 suspicious pattern(s)", "metrics": {}, "source": {}, "details": { "referrer": "None", "timestamp": "2025-10-13 14:17:33", "ip_address": "72.129.237.221", "user_agent": "Mozilla/5.0 (X11; Linux x86_64; rv:128.0) Gecko/20100101 Firefox/128.0", "attack_type": "Code Execution", "request_uri": "/wordpress/wp-login.php?loggedout=system(%22whoami%22)", "request_method": "GET", "suspicious_patterns": [ { "type": "GET", "value": "system(\"whoami\")", "pattern": "system\\s*\\(", "parameter": "loggedout" }, { "type": "URI", "value": "/wordpress/wp-login.php?loggedout=system(%22whoami%22)", "pattern": "system\\s*\\(", "parameter": "REQUEST_URI" } ] }, "remediation": { "steps": [ "Review alert details", "Take appropriate security measures" ], "summary": "Review and block suspicious database queries" }, "ui": { "icon": "🗃️", "color": "#dc2626", "group": "Database" }, "trace": {}, "created_at": "2025-10-13T14:17:35.103978+00:00", "last_seen_at": "2025-10-13T14:17:35.103978+00:00", "id": "dce1076e-b472-4ce8-b960-6c389169a364", "count": 1, "status": "open", "resolved_at": null, "acknowledged_at": null, "resolved_by": null}Mitigation
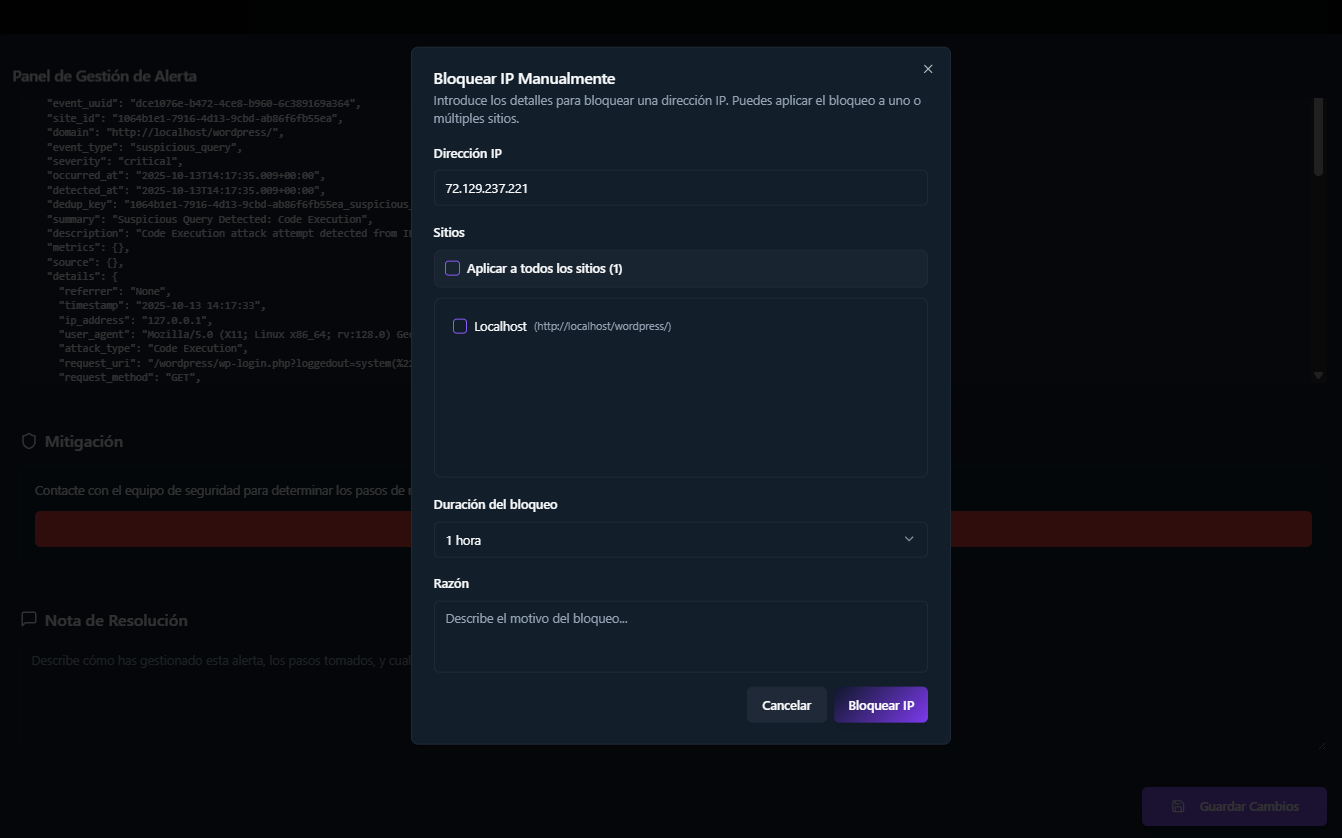
Section titled “Mitigation”The Mitigation section of the panel includes a quick-action button to block the IP responsible for the alert directly, enabling immediate response to attack attempts or malicious activity.
Resolution note
Section titled “Resolution note”The panel also includes a Resolution note section, where the person managing the alert can classify the outcome (for example false positive, malicious, or duplicate) and document the resolution process.
This field records actions taken, technical observations, and decisions, keeping a clear and traceable history of how the incident was resolved.

Next steps
Section titled “Next steps”- Alert catalog — severity criteria, IOCs, and mitigations for each alert type.
- General Overview — SIEM-wide metrics and trends.
- Automations — get alerts by email with notification rules.
- IP Management — blocked IPs, whitelist, and attacker reputation.